Unlock the power of time series analysis for accurate forecasting and trend detection. Learn how to make informed decisions based on data insights.

Time series analysis is a statistical technique that deals with time-ordered data points. It is used to analyze data collected over time to identify patterns, trends, and seasonal variations. This approach is crucial for many fields, including finance, economics, environmental science, and any area where data points are recorded sequentially over time. By systematically studying these time-ordered data, analysts can make informed decisions based on historical performance.
The essence of time series analysis lies in its ability to forecast future values based on historical observations. Forecasting is the process of predicting future outcomes based on the analysis of past data. Various methodologies are employed in this context, including moving averages, exponential smoothing, and ARIMA models, among others. These techniques help in estimating future values, which can be particularly beneficial for businesses and governments in planning and resource allocation.
Another crucial aspect of time series analysis is trend detection. Trends represent the long-term movement of data in a particular direction, either upward or downward. Recognizing these trends allows organizations to adjust their strategies accordingly. For instance, a consistent upward trend in sales data may indicate a growing market demand, prompting businesses to scale their operations. Conversely, a downward trend might prompt a reassessment of marketing strategies or product offerings.
Overall, time series analysis serves as a foundational tool in data analysis, particularly for forecasting future events and detecting underlying trends. Its importance cannot be overstated, as accurate forecasts and comprehensive understanding of trends directly influence strategic decisions. As we delve deeper into this guide, we will explore various techniques and applications of time series analysis, equipping readers with the necessary tools for effective data interpretation.
Time series data is a sequence of data points collected or recorded at specific time intervals. This type of data is distinctly characterized by its chronological ordering, reflecting how a particular variable changes over time. The most vital aspect of time series data is its temporal consistency, which allows for the analysis of trends, seasonality, and cyclical patterns that are essential for creating accurate forecasts.
One of the fundamental features of time series data is the reliance on timestamps, which serve as an essential component for organizing the data chronologically. Each observation in a time series dataset is tagged with a specific time value, crucial for determining the sequence of events. The presence of these timestamps helps analysts and researchers examine how relations and temporal dependencies evolve and influence the dataset over time. Without timestamps, critical information regarding the order of events would be lost.
Moreover, time series data often exhibits unique characteristics, such as trends, seasonality, and irregularities. Trends indicate a long-term movement in the data, yielding insights into whether values are increasing or decreasing over extended periods. Seasonality refers to periodic fluctuations that occur at regular intervals, often associated with specific seasons, months, or days. Understanding these characteristics is vital for effective trend detection and forecasting. For instance, by identifying and segregating seasonal effects, analysts can refine their models significantly and achieve enhanced forecasting accuracy.
In summary, appreciating the unique aspects of time series data—such as its chronological order, reliance on timestamps, and distinctive characteristics—paves the way for deeper analysis and more founded decision-making in fields ranging from finance to meteorology and beyond. Proper handling of these elements is pivotal for mastering time series analysis.
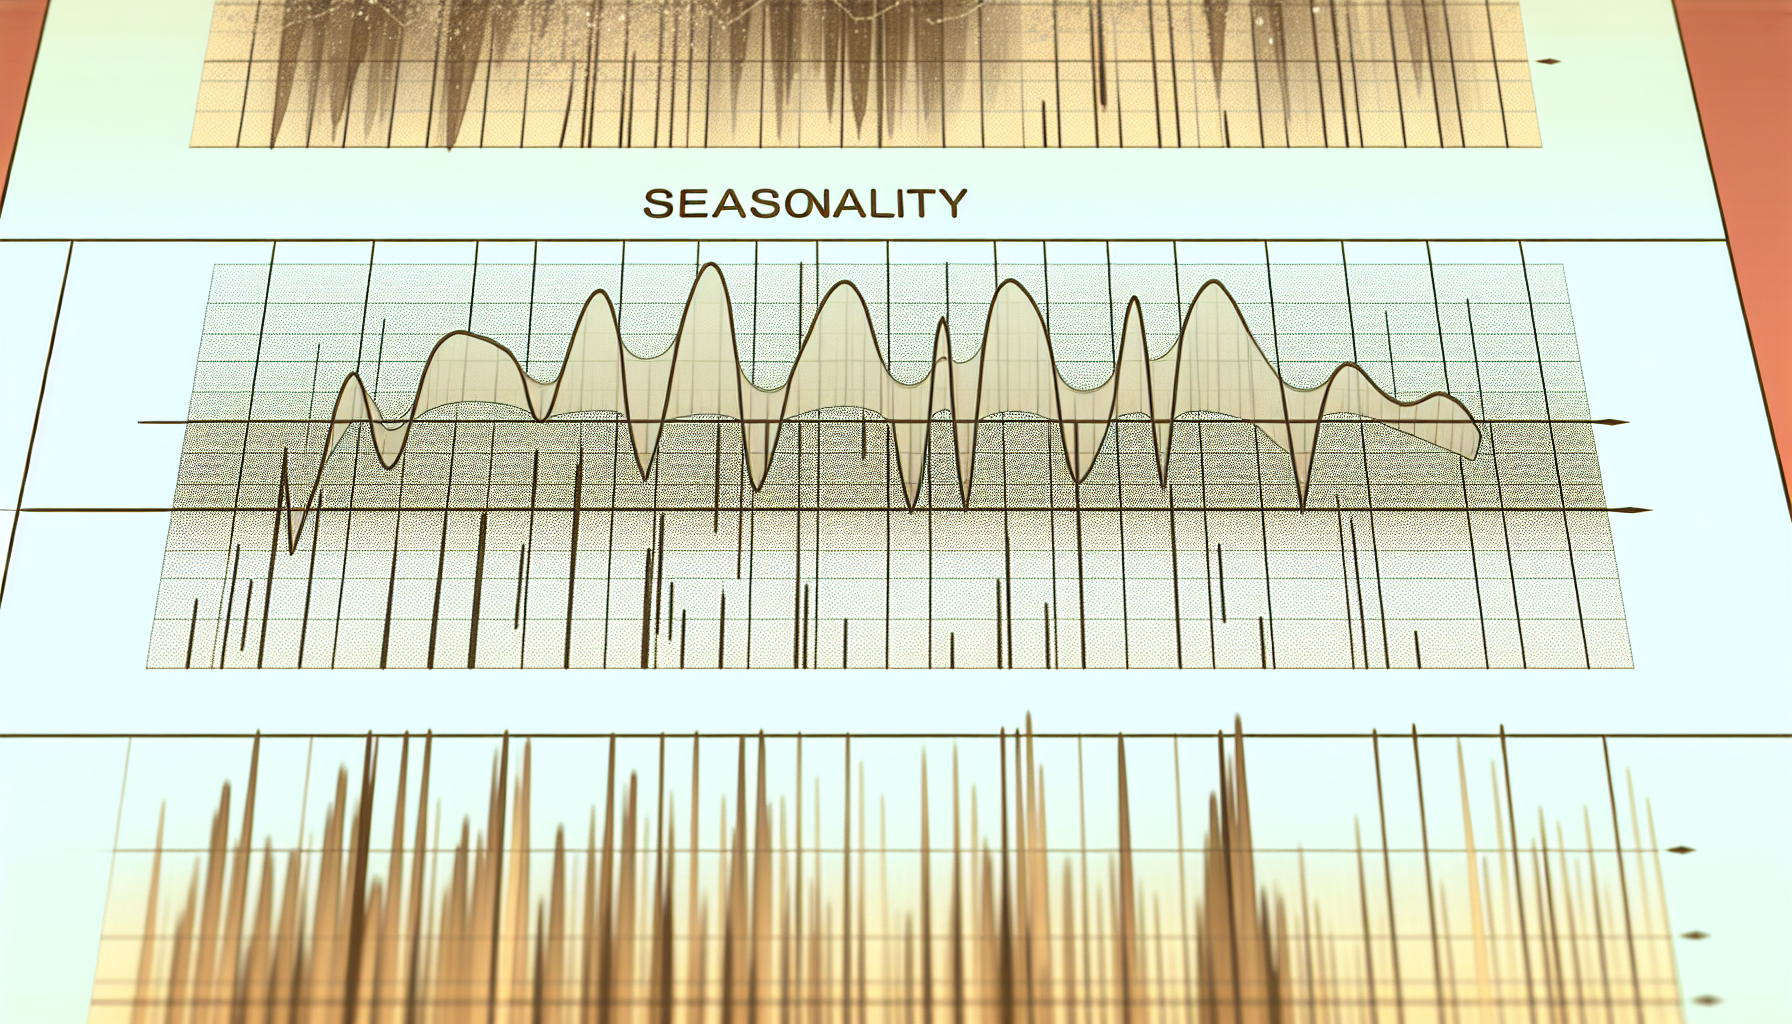
Seasonality is a fundamental concept in time series analysis, referring to predictable and recurring patterns that occur at regular intervals over time. These patterns can be daily, weekly, monthly, or annually, and they often correspond to specific calendar events or changes in external factors. For instance, retail sales typically exhibit an upswing during holiday seasons, while temperature data might show seasonal fluctuations tied to climate changes throughout the year.
Identifying seasonal patterns is crucial for accurate forecasting because they can significantly influence the behavior of a time series. Failure to account for seasonality may lead to misleading conclusions and erroneous predictions, thereby impacting decision-making processes in various fields, including economics, meteorology, and inventory management. Analysts often employ techniques such as seasonal decomposition, which breaks down the time series into its trend, seasonal, and residual components, enabling them to better understand how these elements interact.
To effectively recognize seasonality in a given time series, analysts typically utilize visualization tools such as seasonal subseries plots or autocorrelation functions. These methods allow for the clear identification of consistent patterns that can be attributed to the season. Additionally, statistical tests like the Seasonal Kendall Test can provide further assurance regarding the existence of seasonality within the data.
Moreover, various methods can be applied to model and forecast seasonal data accurately. For example, the Seasonal Autoregressive Integrated Moving Average (SARIMA) model incorporates seasonality in its framework, making it a powerful choice for those looking to generate forecasts based on seasonal patterns. Understanding and recognizing seasonality allows for improved time series analysis, enhancing the capacity to predict future trends effectively.
Trend detection is a vital component of time series analysis, allowing researchers and analysts to uncover underlying patterns within data over time. Recognizing trends can assist in making informed decisions, shaping business strategies, and anticipating future outcomes. Various methodologies, both visual and statistical, are utilized to identify trends effectively.
One of the most straightforward yet powerful methods of trend detection is through visual tools, such as line graphs and scatter plots. These graphical representations allow for an immediate understanding of data movement and trends over a specified period. By plotting data points chronologically, one can quickly identify upward or downward trends. In more complex instances, moving averages can be employed. This technique smoothens data fluctuations, effectively highlighting the overall direction of the trend.
Beyond visual tools, there are several statistical approaches available for trend detection. One commonly used method is regression analysis, which allows analysts to establish relationships between variables and predict future trends. Linear regression, for example, fits a straight line through data points to model the relationship, helping to forecast future values based on historical data. Similarly, polynomial regression can capture non-linear trends, revealing more intricate relationships within the data.
Moreover, advanced techniques, such as Autoregressive Integrated Moving Average (ARIMA) models, offer more sophisticated options for trend detection. ARIMA models combine autoregression and moving averages, enabling users to account for trends, seasonal variations, and random disturbances in the data. This adaptive method makes it particularly effective for complex time series with recognizable patterns.
In summary, understanding and applying various trend detection methods is essential in time series analysis. By combining visual techniques with statistical models, analysts can accurately identify trends and leverage these insights for effective forecasting and strategic planning.
Time series forecasting is a critical aspect of data analysis, allowing analysts and organizations to predict future trends and behaviors based on historical data. Various statistical models have emerged as powerful tools to construct time series forecasts, among which ARIMA, Exponential Smoothing, and Seasonal Decomposition are particularly prominent.
The Autoregressive Integrated Moving Average (ARIMA) model is one of the most utilized approaches in time series analysis. It combines autoregression and moving averages, allowing it to capture a wide range of temporal structures. ARIMA’s flexibility enables it to model non-stationary data by differencing it to achieve stationarity. This model is particularly effective for data that exhibits trends and can be highly customized through its parameters, making it suitable for various forecasting scenarios.
Exponential Smoothing, on the other hand, focuses on reducing the lag in trend detection by applying weights that decrease exponentially over time. This approach is particularly useful for datasets with seasonal patterns. Simple Exponential Smoothing and Holt-Winters seasonal method are popular variations of this model. Each variant serves a unique purpose, allowing forecasters to adapt their strategy according to the complexity of the data, from straightforward smoothing to multi-level seasonality.
Lastly, Seasonal Decomposition of Time Series (STL) stands out for its intuitive separation of seasonal, trend, and residual components of a time series. This method is particularly beneficial for datasets with strong seasonal irregularities. By isolating these components, analysts can gain insights into the underlying patterns, aiding in more accurate forecasts. STL is often employed in conjunction with other models to enhance predictive accuracy.
In summary, the choice of statistical model for time series forecasting is essential for achieving reliable predictions. Each model, including ARIMA, Exponential Smoothing, and Seasonal Decomposition, offers unique strengths and applications, and understanding these can significantly improve forecasting outcomes.
Crafting an effective forecasting model using time series data involves a structured approach characterized by careful data preprocessing, meticulous parameter selection, and rigorous validation techniques. The integrity of the time series data serves as the foundation upon which the forecasting model is built. Therefore, preprocessing is a critical first step that may include handling missing values, smoothing out noise, and transforming the data to stabilize variance and improve its normality. This ensures the data is clean, consistent, and ready for analysis, enabling more accurate model outcomes.
Once the data is preprocessed, the next phase focuses on parameter selection. Selecting the right parameters is essential for tuning the model to its optimal performance. For instance, if employing SARIMA (Seasonal Autoregressive Integrated Moving Average), one must ascertain the values for seasonal and non-seasonal parameters. Techniques such as grid search and cross-validation can assist in evaluating different configurations to identify those that best fit the historical data. By carefully determining parameters, one can significantly enhance the precision of the forecasts generated by the model.
After the parameters are established, applying validation techniques is crucial for assessing the model’s effectiveness. Dividing the data into training and testing sets allows the model to learn from historical data while validating its predictive capabilities on unseen data to reduce overfitting. Popular validation methods, such as the Rolling Forecast Origin and k-fold cross-validation, provide insights into the model’s performance and reliability. Monitoring metrics like Mean Absolute Error (MAE) and Root Mean Squared Error (RMSE) further refines model selection, ensuring that only the best-fit forecasting approach is utilized.
In summary, developing a robust forecasting model through meticulous data preprocessing, careful parameter selection, and rigorous validation techniques is essential for achieving reliable predictions in time series analysis. Each step plays a pivotal role in creating a model capable of accurately forecasting future trends and behaviors.
To ensure the effectiveness and reliability of forecasting models in time series analysis, evaluating their accuracy is paramount. Several metrics exist for assessing the performance of these models, enabling practitioners to determine how well their predictions align with actual outcomes. Among the most frequently used metrics are Mean Absolute Error (MAE) and Mean Squared Error (MSE).
The Mean Absolute Error (MAE) is a straightforward measure that quantifies the average magnitude of errors in a set of predictions, without considering their direction. It is calculated by taking the absolute differences between the predicted and actual values, averaging those differences over the sample size. MAE is particularly advantageous due to its interpretability, as it allows analysts to easily understand the average error amount in the forecasting process. A lower MAE indicates a more accurate forecasting model, making it a valuable tool for model assessment.
Conversely, the Mean Squared Error (MSE) provides another perspective on forecasting accuracy. It specifically measures the average of the squares of the errors, enforcing a higher penalty on larger discrepancies. This characteristic makes MSE useful for highlighting significant errors that could disproportionately affect forecasting performance. Like MAE, a lower MSE signifies a more accurate model. However, the squaring of errors may skew results, so it is essential to interpret this metric with caution.
Beyond MAE and MSE, additional metrics, such as Root Mean Squared Error (RMSE) and Mean Absolute Percentage Error (MAPE), also serve vital roles in model evaluation. RMSE represents the square root of MSE, providing error magnitude in the same units as the data, while MAPE offers a percentage error measure, which can be useful for cross-model comparisons. By employing a combination of these metrics, analysts can gain a comprehensive understanding of a forecasting model’s predictive power, ultimately enabling them to refine their time series analysis practices.
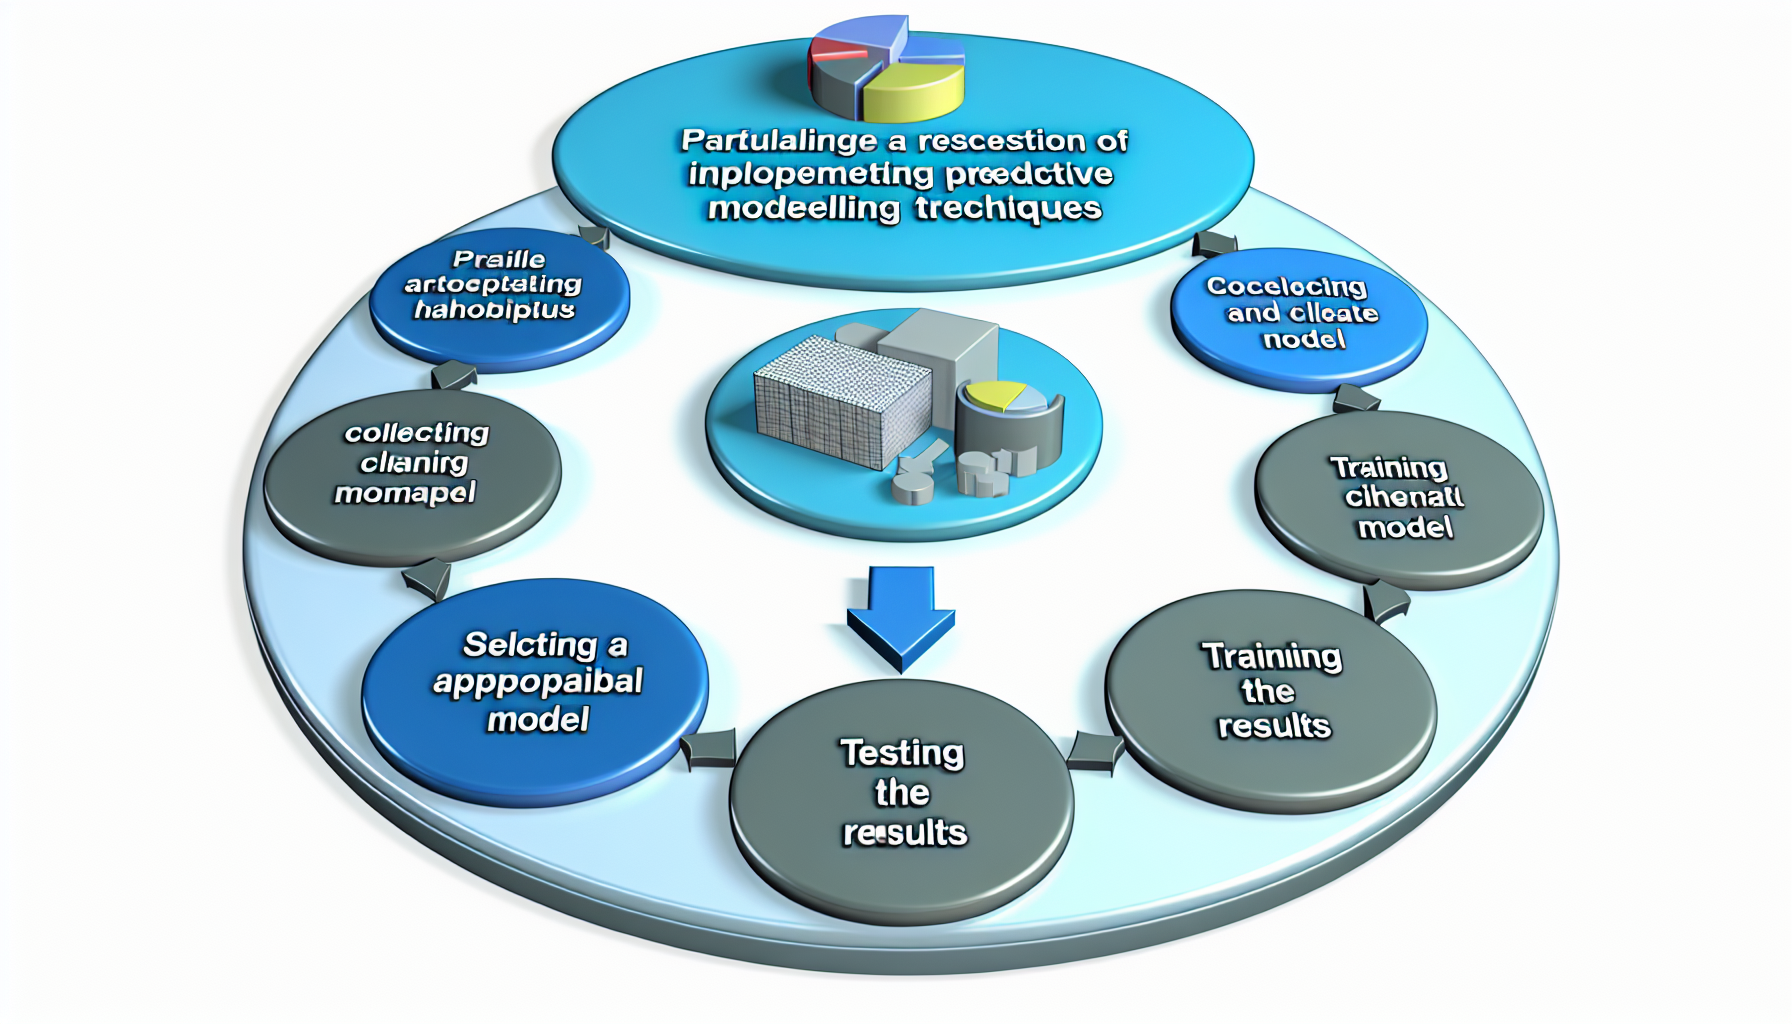
Integrating predictive modeling techniques into time series analysis significantly enhances the accuracy and reliability of forecasting outcomes. Traditional methodologies often struggle with nonlinear relationships and complex patterns that real-world data exhibits. To address these limitations, machine learning approaches can be employed to complement existing time series methods. This section explores various machine learning algorithms that can improve forecasting efficiency.
First, decision trees offer a straightforward yet powerful approach. These algorithms operate by creating a structured flow of decisions based on the input variables, enabling the model to identify patterns in data. They are particularly useful in situations where interactions between different predictors are complex. Random forests, an ensemble method based on decision trees, aggregates multiple trees to enhance predictive performance and reduce the likelihood of overfitting.
Another potent technique is the use of neural networks, such as Long Short-Term Memory (LSTM) networks. LSTMs are designed to capture long-term dependencies in sequential data, which is vital for time series forecasting. Their architecture allows them to retain information over extended periods, making them effective for modeling data with time-dependent characteristics. Furthermore, they can adapt to non-linear relationships, providing a significant advantage over traditional linear approaches.
Support Vector Machines (SVM) can also be applied in time series forecasting. By transforming the original data into a higher-dimensional space, SVM identifies the optimal hyperplane that best separates the data classes, making it effective for regression tasks. Utilizing these machine learning methods alongside traditional time series models, such as ARIMA or Exponential Smoothing, can yield superior results in forecasting accuracy.
Ultimately, by combining these predictive modeling techniques, analysts can enrich their time series analysis, leading to more robust and reliable forecasting outcomes. This integration not only aids in trend detection but also equips practitioners with the tools necessary to tackle complex datasets efficiently.
Time series analysis is a specialized field within data analytics that requires robust tools and software capable of handling sequential data. Among the most popular programming languages for this purpose are Python and R, both of which offer extensive libraries optimized for time series analysis. Python, known for its simplicity and versatility, includes libraries such as Pandas, NumPy, and Statsmodels that facilitate data manipulation, statistical modeling, and forecasting. Its visualization libraries, like Matplotlib and Seaborn, provide powerful tools for data representation, enabling users to easily identify trends and patterns.
R, on the other hand, is highly regarded in the statistical community for its advanced analytical capabilities. It provides several packages specifically designed for time series analysis, such as ‘forecast’ and ‘xts’. The ‘forecast’ package excels at generating accurate predictions and offers functions for various forecasting techniques, including ARIMA and exponential smoothing. Meanwhile, ‘ggplot2’ serves as an excellent visualization tool within R, offering users ways to create complex and informative visualizations that highlight trends and cyclical patterns in their data.
Beyond programming languages, dedicated software platforms have emerged to support time series analysis. Tableau is a prominent example; it is user-friendly and designed for complex data visualizations without requiring extensive programming knowledge. Tableau’s capabilities for trend detection through interactive dashboards allow businesses to explore and present their time series data effectively. Furthermore, Microsoft Excel remains a staple for many analysts, as its built-in functions and templates are suitable for elementary time series forecasting tasks.
Overall, choosing the right tools for time series analysis is paramount. Whether one opts for programming languages like Python and R or user-friendly software like Tableau and Excel, the features and functionalities available can significantly enhance the forecasting process and aid in trend detection.
Time series analysis has become an indispensable tool across various industries, enabling organizations to forecast future outcomes based on historical data. In finance, for instance, time series analysis is extensively used to predict stock prices and economic trends. Financial analysts utilize historical stock price data trends, employing techniques like ARIMA models or exponential smoothing to inform investment strategies. These predictions help investors make informed decisions about buying or selling securities, ultimately impacting the overall market.
Similarly, in the retail sector, enterprises leverage time series analysis to optimize inventory management. By analyzing sales data over different periods, retailers can forecast demand for products at various times of the year, such as during holidays or seasonal trends. This forecasting allows for better stock management, reducing the risks of overstocking or stockouts, which can lead to lost sales and customer dissatisfaction. Retailers can apply various methods from simple moving averages to more sophisticated machine-learning models to enhance their predictive accuracy.
In meteorology, time series analysis plays a critical role in weather forecasting. Meteorologists analyze historical weather data to identify patterns that can indicate future conditions. By employing time series models, they predict temperature, precipitation, and other weather events, providing essential information that impacts agriculture, disaster management, and daily life. This predictive capability allows communities to prepare for extreme weather events, reducing potential losses and enhancing public safety.
Overall, the effectiveness of time series analysis in these diverse fields underscores its significance. As organizations increasingly rely on data-driven decision-making, mastering time series analysis will enable better forecasting and trend detection, thereby improving operational efficiency and strategic planning across sectors.
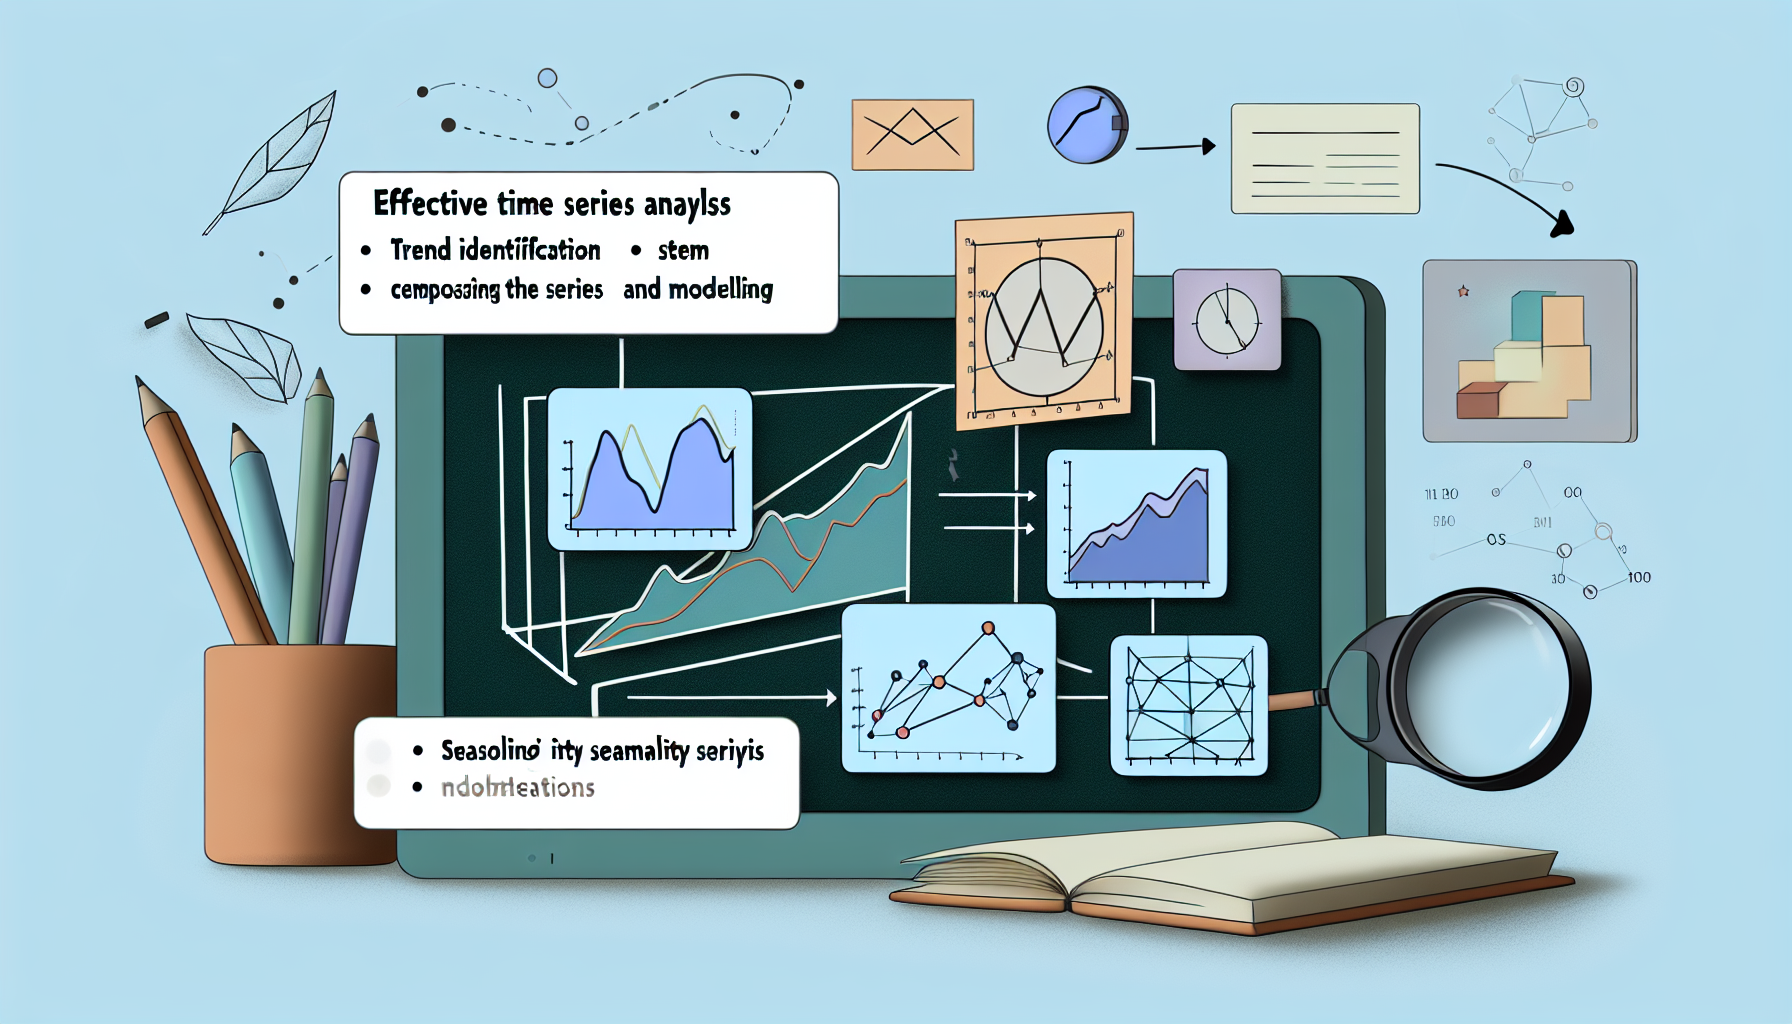
To enhance the effectiveness of time series analysis, implementing best practices is crucial. One of the foremost strategies involves ensuring data quality. Time series data can often be plagued by inconsistencies, missing values, and outliers. Therefore, it is important to perform thorough data cleaning before analysis. Employ techniques such as interpolation for missing values and robust statistical methods to identify and manage outliers, which can otherwise skew results.
Another tip is to understand the properties of your data. Time series data often exhibit trends, seasonality, and cyclic patterns. By employing decomposition methods, one can separate these components for clearer analysis. This decomposition also allows for better forecasting, as models can be built to incorporate each element specifically. For instance, seasonal decomposition can significantly improve the performance of models like ARIMA (AutoRegressive Integrated Moving Average) by appropriately accounting for seasonal variations.
Utilizing the right model is also key to effective time series analysis. It is advisable to explore various modeling techniques such as exponential smoothing, ARIMA, and new advances like machine learning-based models. Comparison and validation of forecasts from different models can lead to insights that might be overlooked with just one approach. Also, make sure to employ performance metrics, such as Mean Absolute Error (MAE) and Root Mean Square Error (RMSE), to evaluate the accuracy of forecasts.
Furthermore, be mindful of overfitting, a common pitfall in time series analysis. While it can be tempting to develop complex models that forecast extraordinarily well on training data, such models often fail to generalize to unseen cases. Simplistic but effective models tend to yield more reliable forecasts, ensuring that the model captures essential components without becoming overly complicated.
Lastly, consider the importance of visualizations. Graphical representations can reveal patterns and anomalies that may not be evident through numerical analysis alone. Tools such as autocorrelation plots and time series plots can be invaluable for both exploratory analysis and for communicating findings to stakeholders.
As we delve into the future of time series analysis, it is clear that technological advancements, particularly the incorporation of artificial intelligence (AI) and machine learning, are shaping the landscape of this field. These innovations allow for more sophisticated data processing and enhanced predictive capacity, which significantly improve the accuracy of forecasts derived from time series data.
AI-driven algorithms enable analysts to handle high-dimensional datasets, making it easier to uncover intricate patterns and trends that may not be immediately visible. Machine learning techniques, such as neural networks and ensemble methods, are steadily gaining traction as they can learn from past data to make more reliable predictions about future values. This shift towards automated analyses means that organizations can process large volumes of time series data quickly, leading to timely decision-making that is backed by solid predictive analytics.
Moreover, the emergence of big data technologies has opened new avenues for time series analysis. As data collection becomes more extensive, the ability to analyze diverse datasets in real-time has become crucial. Cloud computing solutions facilitate the storage and processing of massive time series datasets, allowing researchers and businesses alike to leverage these advancements for improved forecasting and trend detection. The integration of Internet of Things (IoT) devices has also accelerated the generation of real-time time series data, driving the demand for more innovative analysis techniques.
Looking ahead, future research in time series analysis may focus on enhancing algorithm interpretability and transparency, which are critical for gaining trust in AI-assisted predictions. Additionally, addressing the challenges of data quality and the impact of external variables on time series models remains a priority. As these trends continue to evolve, the potential applications of time series analysis will undoubtedly expand, providing valuable insights across various sectors, including finance, healthcare, and climate science.
Time series analysis offers profound insights into data that varies over time, enabling organizations and individuals to forecast future trends and make informed decisions. Throughout this guide, we have explored various methodologies and techniques essential for mastering this analytical approach. From understanding the fundamental concepts of time series to implementing sophisticated statistical models, the breadth of knowledge gained can significantly enhance predictive capabilities.
One of the most critical takeaways from our discussion is the importance of accurately identifying patterns within time series data. These patterns, whether they manifest as trends, seasonality, or cyclical variations, provide valuable information that can be harnessed to anticipate future occurrences. Mastery of tools such as autoregressive integrated moving averages (ARIMA) and exponential smoothing allows analysts to leverage historical data effectively for forecasting. The ability to dissect and interpret these time series components is paramount for achieving precise predictions and recognizing potential shifts in trends.
Moreover, the significance of data quality cannot be overstated. Ensuring that the dataset is clean, complete, and consistent is vital for producing reliable analyses. As organizations strive to be data-driven, the integration of advanced time series analysis techniques will play a crucial role in optimizing strategies and improving outcomes across various domains. It is essential for readers to apply the insights gained from this guide actively. Engaging with additional resources, participating in relevant courses, or collaborating with experts can deepen one’s understanding and proficiency in time series analysis.
Ultimately, time series analysis stands as a powerful tool in the realm of data science. By honing skills in this area, practitioners can unlock new opportunities for innovation and progress in their respective fields. Embrace the potential of time series analysis and pave the way for more effective decision-making and trend detection.
Looking to advertise, promote your brand, or explore partnership opportunities?
Reach out to us at
[email protected]








Chose where you want to study, and we will let you know with more updates.